Running Ranking System Statistics 2026
Running Ranking System Statistics 2026
World Athletics processes more than 1,000,000 results from over 10,000 competitions worldwide every year, giving more than 70,000 athletes a valid ranking score each week. Gamified apps that include ranking features retain users at rates 22% higher than non-gamified alternatives. Runners who can see their rank relative to peers train more consistently - a fact backed by a growing body of research on competitive motivation. These 15 statistics reveal how ranking systems - from elite road racing to everyday running apps - are reshaping who runs and how often.
Ranking systems have existed in athletics for decades, but their reach has expanded dramatically into recreational running. Where rankings once belonged to elite athletes logged in meet databases, they now live in the pocket of every runner with a phone. That shift is changing the behavior of tens of millions of people.
This post covers 15 verified statistics on running ranking systems - how they work at the elite level, what they do to motivation at the recreational level, and why competitive tier systems are becoming one of the most powerful tools for keeping runners consistent. The data spans World Athletics, global fitness app research, and behavioral science.
1. World Athletics Processes Over 1 Million Results Per Year
World Athletics processes more than 1,000,000 results from over 10,000 competitions worldwide each year to feed into its global rankings. At any given week, more than 70,000 athletes across all four corners of the world hold a valid ranking score across the 48 athletics event groups. The scale of this system is easy to underestimate - more athletes are actively ranked today than at any point in the sport's history. For elite runners, that score is the gateway to world championships, Olympic qualifications, and prize money. The infrastructure behind it provides the blueprint that recreational ranking systems now adapt.
Source: World Athletics - Introduction to World Rankings
2. Running Race Participation Hit 50 Million in the US in 2024
Running and jogging surpassed 50 million participants in the United States for the first time since 2020, according to SFIA's 2024 participation report. The figure marks a full recovery from pandemic-era lows and positions running as one of the most widely practiced sports in the country. For ranking systems - whether race-based or app-based - a participant pool this large creates the conditions for meaningful competition at every speed tier. More runners means more data, tighter leaderboards, and stronger incentives for the mid-pack runner to chase a position.
Source: SFIA - Topline Participation Report 2024
3. Race Participation Grew 8.2% Per Race in 2024
Races grew an average of 8.2% per event over the course of 2024, according to the RunSignup 2024 RaceTrends report covering more than 85,000 events and 10.8 million registrations. The growth rate followed an 11% gain in 2023, meaning the competitive running calendar expanded for the second consecutive year. Events with race-day ranking features - live leaderboards, age-group placements, and official finishing positions - draw participants who value seeing where they stand. The continued participation growth creates a larger audience for ranking-driven formats.
Source: RunSignup 2024 RaceTrends Report
4. Gamified Apps with Rankings Retain Users 22% Longer
User retention rates for brands that use gamification - including ranking and tier systems - in their mobile apps improve by 22% on average compared to non-gamified alternatives. The figure comes from research tracking app engagement across multiple verticals, with fitness among the most studied. For running apps specifically, rank visibility gives users a concrete reason to open the app again tomorrow - not to check stats, but to check their position. That single behavioral hook is worth more than most onboarding flows in driving return visits.
Source: InAppStory - Gamification Statistics 2025
5. The Global Gamification Market Is Worth $19.4 Billion in 2025
The global gamification market reached $19.42 billion in 2025 and is projected to hit $92.5 billion by 2030, growing at a CAGR of 26.02%. Running apps that incorporate ranking, XP, and tier systems sit within this market. The scale of investment signals that ranking mechanics are no longer a novelty feature - they are a core product strategy. Fitness is one of the sectors driving the fastest adoption, alongside HR tech and e-learning. Runners benefit from this investment through better-designed, more motivating ranking experiences inside the apps they already use.
Source: Beeliked - Gamification Market Trends 2025
6. Leaderboard and Status Features Rank as the Most Popular Gamification Elements
Among all gamification features studied in fitness app research, leaderboards and status markers consistently rank as the most popular with users - outpacing badges, points alone, and streak tracking. Users engage more with systems where their position relative to others is visible, not just their own progress in isolation. Competitive social comparison is a documented motivational mechanism: knowing you are two places behind a friend creates a specific, actionable goal in a way that knowing you ran 4.3 miles does not.
Source: University of South Australia - Gamification of Fitness Apps
7. Gamified Fitness Apps Produced 489 More Daily Steps vs. Non-Gamified Apps
A meta-analysis of 36 randomized controlled trials with 10,079 participants found that gamified health apps produced statistically significant improvements: 489 additional daily steps, 0.70 kg less body weight, and 1.92% less body fat compared with non-gamified alternatives. While modest in isolation, 489 extra steps per day compounds to roughly 178,000 steps per year - or about 85 additional miles of movement. For running apps, ranking systems that reward each logged run with XP and tier progress are the delivery mechanism for this behavioral change.
Source: eClinicalMedicine / The Lancet - Meta-analysis of gamified health apps 2024
8. World Athletics Road Running Rankings Cover an 18-Month Window
World Athletics uses an 18-month rolling ranking period for road running events - longer than the 12-month window used for track and field events. This choice reflects the lower frequency of road racing: a runner may only compete in three or four ranked road races per year, so a 12-month window would produce rankings too sparse to be meaningful. The 18-month window keeps more athletes in the ranked pool and creates a more accurate picture of current ability. Recreational ranking systems face the same design challenge - ranking windows that are too short exclude inconsistent runners; windows that are too long fail to reflect current form.
Source: World Athletics - Road Running Ranking Rules 2025
9. Rank Decay Is a Core Mechanic in Elite and Recreational Systems Alike
Both World Athletics and consumer running apps use a form of rank decay - the concept that inactivity reduces your ranking score over time. World Athletics allows modification of performance scores to account for the age of the result within the ranking window. Consumer apps increasingly mirror this with decay mechanics that drop your tier if you stop logging runs. Decay creates urgency that pure milestone systems lack: the next run is not just about gaining ground, it is about not losing what you have already earned. Research on commitment devices shows that loss aversion is a stronger behavioral driver than reward gain.
Source: World Athletics - Basics of the World Rankings
10. Nike Run Club Saw 21% Retention Gains After Adding Gamified Features
Nike Run Club saw a 21% increase in retention after introducing gamified features including leaderboards and social challenges. The app consistently ranks among the most used fitness applications globally. The retention gain is a direct consequence of competitive social mechanics - when runners can see where friends rank, they return more often. Nike's experience is consistent with findings across other high-scale fitness apps and provides a concrete commercial anchor for the value of ranking features beyond motivational theory.
Source: Trophy - Nike Run Club Gamification Case Study
11. Strava's Gamification Produces 80% Retention After 9 Weeks
Strava's gamification strategy - built around segments, KOM/QOM leaderboards, and time-bound challenges - produces an 80% retention rate after 9 weeks of use, considerably above the industry average for fitness apps. Health and fitness apps typically retain about 4% of users by day 30. The gap between the industry norm and Strava's outcome is largely attributable to competitive ranking features: segment leaderboards give every runner a personal competition, even on a solo training run. A runner who sets a personal record on a local segment sees their new rank immediately, which triggers return engagement.
Source: Trophy - Strava Gamification Case Study
12. Health and Fitness Apps Retain Just 4% of Users by Day 30
Standard health and fitness apps retain roughly 20% of users on day one, dropping to 4% by day 30. The average across all app categories sits at 5.7% by day 30. Apps without ranking features give users no competitive reason to return after the initial novelty fades. Running apps that incorporate visible ranking - where each session moves you up or down a leaderboard - consistently outperform this baseline. The ranking hook transforms a logging session into a competitive act, which changes the psychological calculation around whether to open the app today.
Source: Lucid - Retention Metrics for Fitness Apps
13. 22% of Strava Users Cite Workout Stats and Streaks as a Reason They Exercise
Twenty-two percent of Strava users in the 2024 Year in Sport report cited their workout stats and streaks as reasons they exercise. This places visible metrics - including rankings and comparative data - among the top-cited motivators in a population of 135 million active users. The finding is significant because it comes from behavioral data, not a survey asking about hypothetical motivations. These are runners who are already active and attribute part of their continued activity to the visibility of their progress within a system that ranks and measures them.
Source: Strava Year in Sport 2024
14. 72% of Strava Running Goals Were Met in 2024
Seventy-two percent of running goals set on Strava in 2024 were completed, based on activity data from the platform's 135+ million global users. Goal completion rates rise when progress is visible and socially anchored. Runners who could see their distance accumulate against a target - and see where they stood relative to friends - closed their goals at rates far above those tracking in isolation. Ranking systems create exactly this environment: the goal is not abstract mileage but a concrete position in a competitive structure.
Source: Strava Year in Sport 2024
15. Apps That Add Social Features Retain Users at Rates 30% Higher
Apps and programs that incorporate social features - leaderboards, challenges, and friend comparisons - retain users at rates 30% higher than solo-tracking counterparts. The mechanism is straightforward: when your rank is visible to people you know, you have a social reason to maintain it. Solo tracking is private and personal; ranking is public and competitive. That shift from private to competitive creates a fundamentally different motivation profile, one that keeps runners returning long after the initial curiosity about an app has faded.
Source: SparkDay - Step Challenge With Friends Research
What These Numbers Tell Runners
The data points in one direction: ranking systems work. Whether the system is World Athletics assigning performance scores to elite road runners or a consumer app moving a recreational runner through XP tiers, the visible rank changes behavior. The meta-analysis evidence is clear that gamification produces real physical activity gains, not just engagement metrics. The 489 extra daily steps logged by users of gamified apps translate into miles, and those miles have health consequences.
For everyday runners, the most important insight from this data is that competition does not require a race entry fee or a timing chip. App-based ranking systems create competitive frames around every training run. The 22% retention gain and the 30% social-feature advantage are not small margins - they are the difference between a runner who builds a habit and one who quits by day 30.
The trajectory points toward richer, more granular ranking systems. As GPS watch data becomes more precise and app analytics mature, ranking will move beyond simple distance totals toward performance-adjusted scores that compare effort across different terrains, weather conditions, and runner profiles. Runners who engage with ranking systems now are building data histories that will become increasingly valuable as these systems grow more sophisticated.
Running ranking systems are no longer a feature for competitive elites - they are the most effective behavioral tool the recreational running world has for keeping people running consistently.
Runify and the Ranked Running Movement
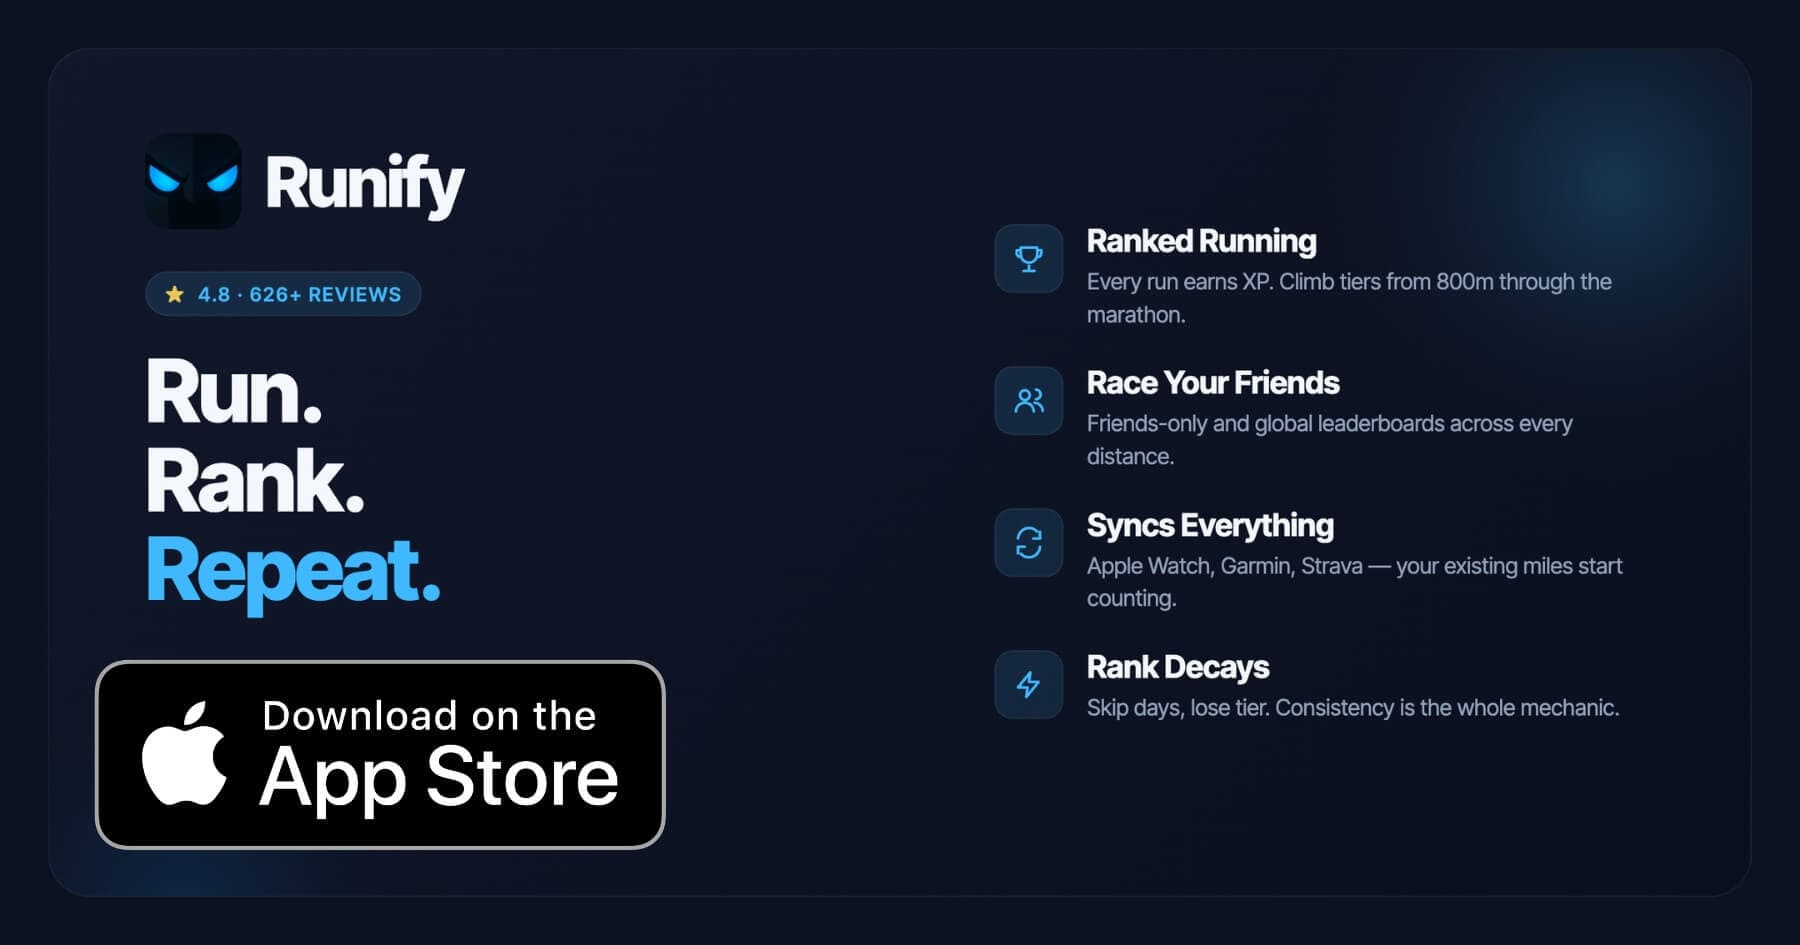
Runify was built for exactly the runner these statistics describe. Every run you log - whether directly or synced from Apple Watch, Garmin, or Strava - earns XP that moves you through a competitive tier system. Keep running and your rank climbs. Go inactive and it decays, just like the World Athletics ranking window. That mechanic is not accidental: rank decay creates the urgency that turns a missed week from a non-event into a concrete loss worth avoiding.
Leaderboards cover six distances - 800m, 1K, 5K, 10K, half marathon, and marathon - so your ranking reflects where you actually race, not just overall mileage. With 4.8 stars and 626+ reviews on the App Store, and more than 100,000 runs logged by the community, the data is already in. Our running app usage deep-dive and running motivation research both point to the same conclusion: visible progress beats invisible progress, every time.
Ready to see where you rank? Download Runify on the App Store and turn every mile into XP across leaderboards from 800m through the marathon.
4.8 stars on the App Store, 626+ reviews worldwide.
Download Runify on the App Store

4.8 on the App Store · Built for iOS